Data Visualisation
and Reporting
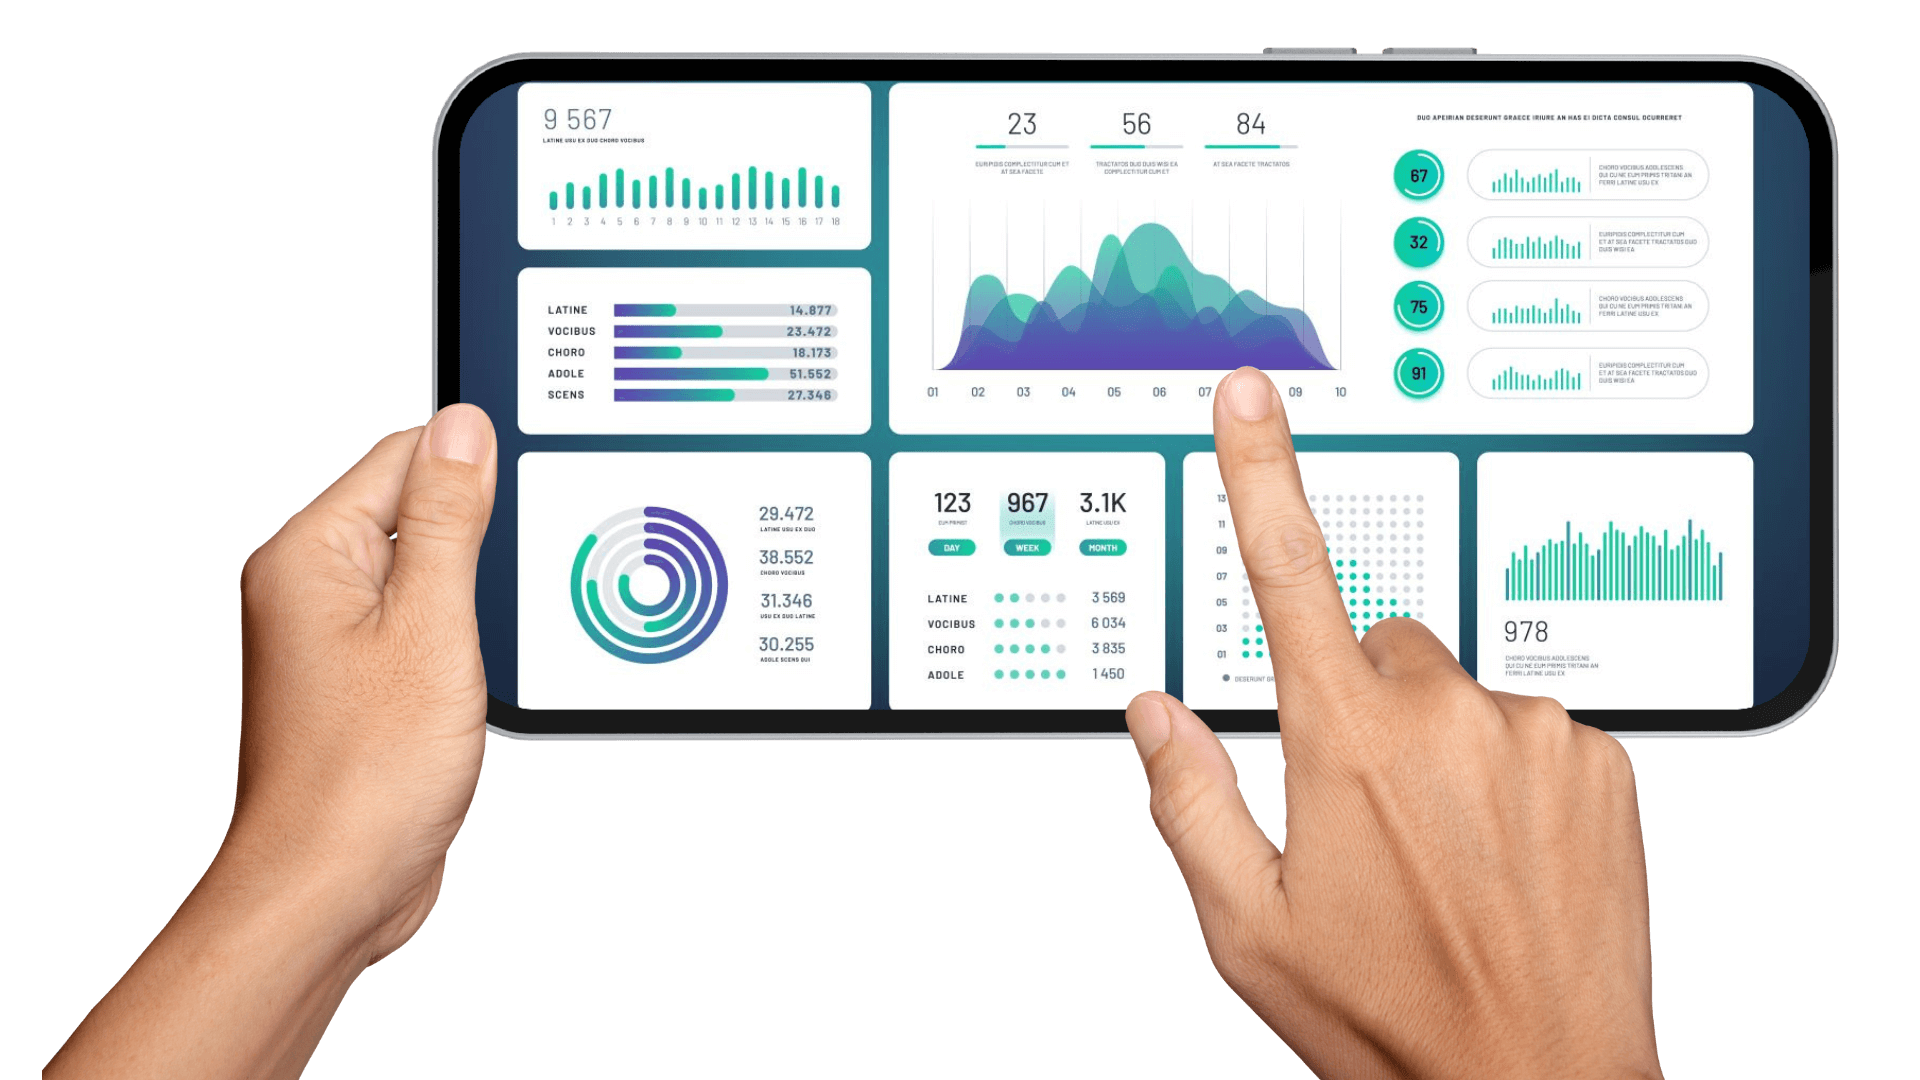
Visualize your success
We help you take the action
Deep expertise in BI Platforms
Offerings
Aggregating & Managing Data
- Collecting useful data
- Managing data – prepare base data to enable quality analytics
Managing Reporting Services
- BI platforms
- Automated reporting services
Creating Visualization and Dashboards
- Dashboard development
- Data visualization
Benefits
- Faster analysis & intuitive dashboards
- Increased organizational efficiency
- Prevention of revenue loss due to fraudulent activities
- Data-driven business decisions
- Trusted and governed data
FAQs
Data visualization services involve the use of graphical representations, such as charts, graphs, and maps, to communicate data insights effectively. These services help businesses understand complex data quickly and make informed decisions.
While the exact steps can vary, a common process includes:
- Data Collection: Gathering the necessary data.
- Data Cleaning: Ensuring data accuracy and consistency.
- Data Transformation: Formatting data for visualization.
- Visualization Selection: Choosing the appropriate chart or graph type.
- Presentation: Creating and presenting the visualization.
Data visualization is used for a variety of purposes, including identifying trends and patterns, communicating insights to stakeholders, monitoring performance, making data-driven decisions, and exploring data relationships.
There are many types of data visualization, including bar charts, line graphs, pie charts, scatter plots, heatmaps, and geographical maps. The choice of visualization depends on the type of data and the story being conveyed.
Data visualization plays a crucial role in business by enabling better understanding of data, facilitating faster decision-making, improving communication, identifying opportunities and risks, and enhancing overall business performance.
A business intelligence service provides the technology and processes to collect, store, analyze, and present business data to support decision-making. These services help organizations gain insights into their operations, customers, and markets.
Business intelligence consulting services offer expert guidance and support in implementing and optimizing business intelligence solutions. This includes strategy development, data warehousing, data analysis, reporting, and dashboard creation.
The work of business intelligence involves gathering data from various sources, cleaning and transforming it, analyzing it to identify trends and patterns, and presenting the findings in a clear and actionable format to business users.
Business intelligence is used across all departments and levels of an organization, including sales, marketing, finance, operations, and human resources. It helps improve decision-making in areas such as customer relationship management, financial planning, supply chain optimization, and employee performance.